
Class attendance
83%
Upload your student Excel file, analyze attendance and performance automatically, identify students needing attention, and generate a professional PDF report in seconds.
3-day free trial, then $20.00 every 3 months.
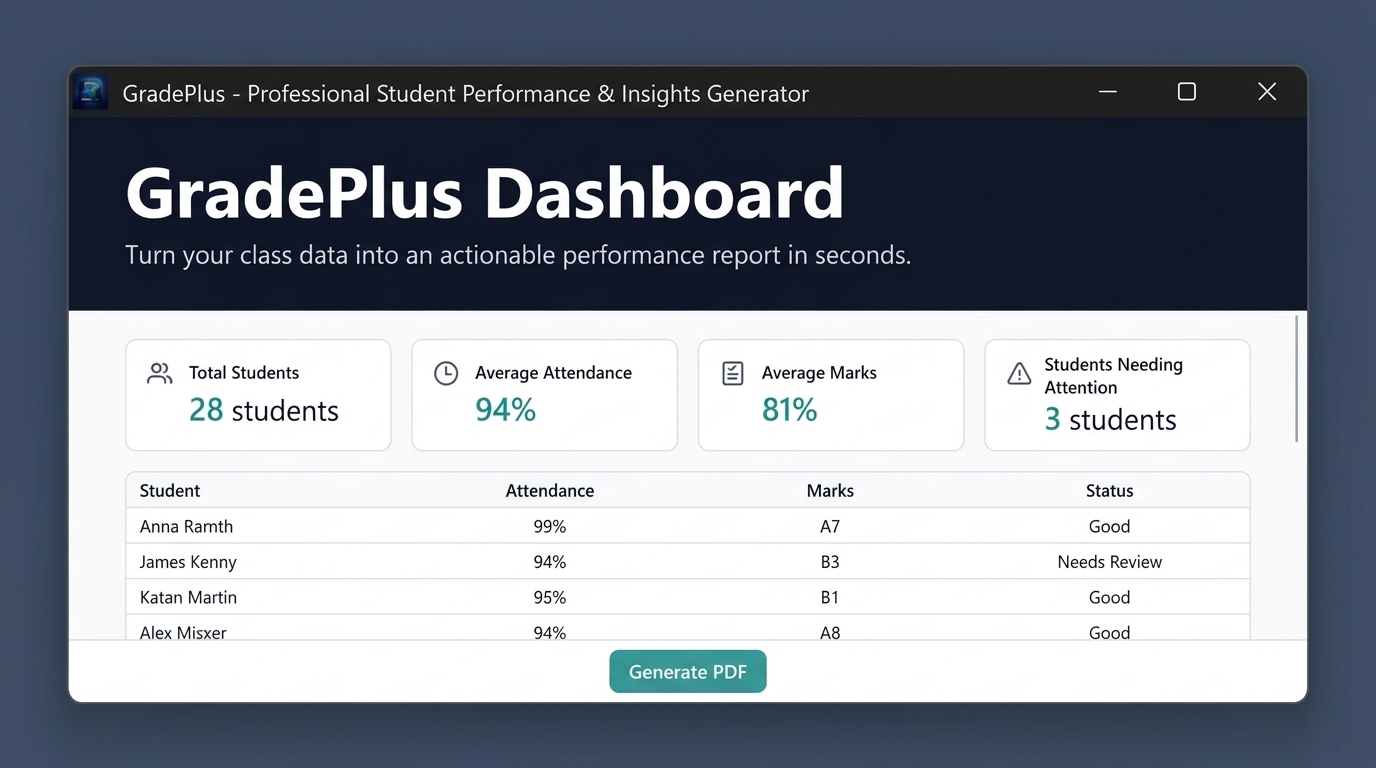
Upload an Excel file of attendance and marks, then get a clear summary of class performance. This is a sample Period 3 Science week.
| Student | Mon | Tue | Wed | Thu | Fri | Quiz | Lab | Test |
|---|---|---|---|---|---|---|---|---|
| P | Present | P | 1 | P | 94 | 90 | 88 | |
| P | A | P | P | late | 78 | 82 | 71 | |
| P | P | abs | A | P | 61 | 70 | 58 | |
| P | P | P | P | P | 85 | 88 | 91 | |
| A | abs | P | P | P | 72 | 65 | 69 | |
| P | 1 | P | late | P | 90 | 93 | 86 |
GradePulse summary · Period 3 Science
Class attendance
83%
Total absences
5
Weighted average
79.0
Need attention
2
| Student | Absences | Attendance | Weighted avg | Status |
|---|---|---|---|---|
| 0 | 100% | 89.8 | On track | |
| 1 | 80% | 75.7 | On track | |
| 2 | 60% | 62.2 | Needs attention | |
| 0 | 100% | 88.9 | On track | |
| 2 | 60% | 68.4 | Needs attention | |
| 0 | 100% | 88.9 | On track |
Student summary card
Student summary card
Try GradePulse on your own spreadsheet. Cancel anytime.
See how GradePlus turns an Excel spreadsheet into a professional performance report.
Raw spreadsheets are useful, but preparing student performance reports manually can involve repetitive calculations, filtering, formatting, and PDF creation. GradePlus puts those steps into one simple workflow.
Spend time calculating attendance and performance statistics.
Manually filtering large spreadsheets can be repetitive.
Formatting tables and preparing PDFs takes unnecessary time.
Upload your Excel spreadsheet.
GradePlus processes attendance, marks, and performance data.
Generate a professional PDF report ready to save or share.
Process student spreadsheet data automatically.
Calculate average attendance and identify records below your configured threshold.
Analyze marks and identify students requiring attention.
Generate complete formatted reports instead of manually preparing them.
Generate a focused report for a selected student.
Configure attendance and marks thresholds for your reporting needs.
Use GradePlus as a dedicated desktop application.
Upload → Analyze → Generate.
Preview frames of the GradePlus Windows app. Empty slots are ready for your own screenshots.
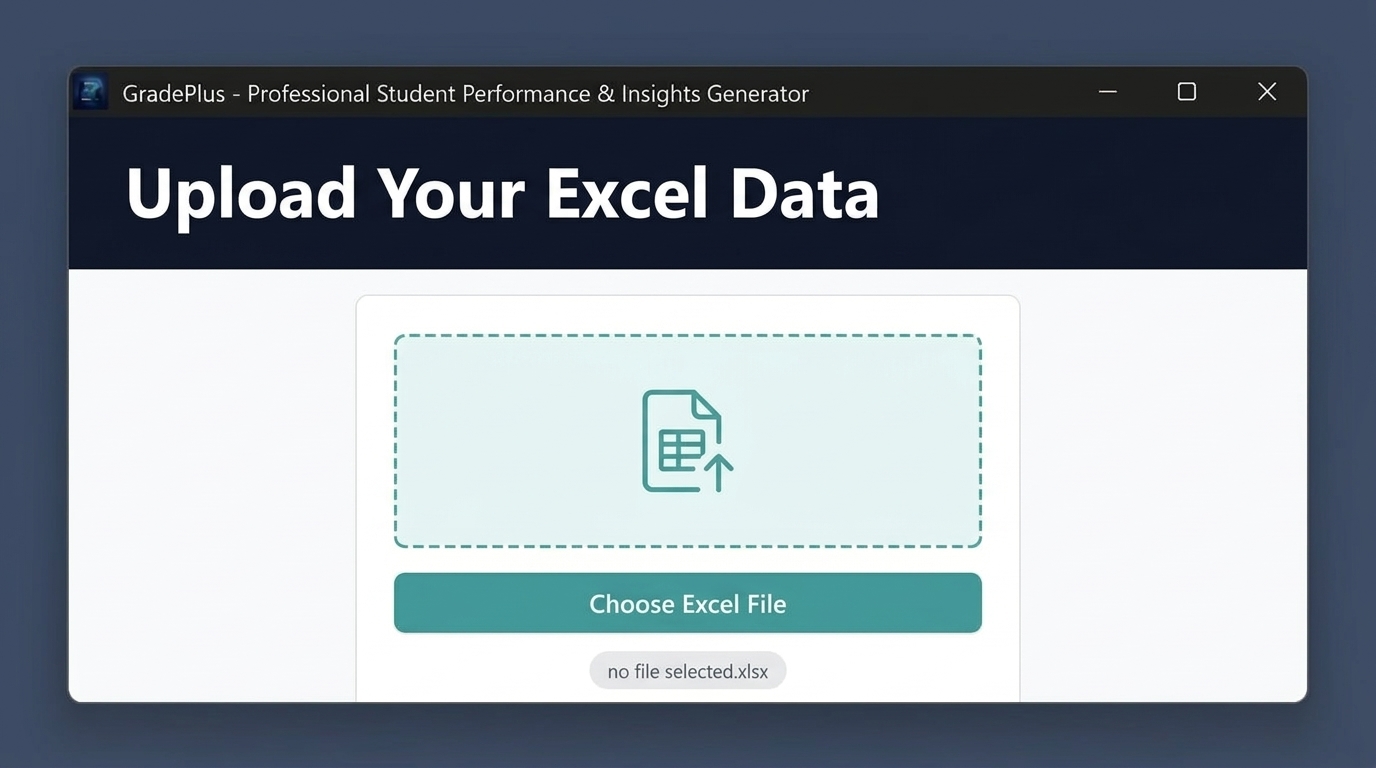
Quickly prepare student performance reports.
Handle reporting across multiple students.
Turn spreadsheet data into structured reports.
Simplify recurring performance reporting.
Automate calculations and report preparation.
Generate reports using the same structured format.
See attendance, marks, averages, and students needing attention in one place.
$20.00
every 3 months
GradePlus is a Windows desktop application that processes student Excel data and generates structured performance reports.
GradePlus is designed to work with Excel .xlsx files.
No. GradePlus is designed around a simple upload, analysis, and report-generation workflow.
Yes. GradePlus can generate professional PDF reports from processed student data.
Yes. The application supports configurable attendance and marks thresholds.
No. GradePlus is designed as a Windows desktop application.
It is designed for tutors, tuition centres, coaching institutes, schools, training organizations, and other users who regularly work with student performance spreadsheets.
Upload your Excel data and let GradePlus handle the repetitive reporting work.